

Welcome, dear reader, to another post from my blog. On this new series, we will talk about a architecture specially designed to process data from log files coming from applications, with the junction of 3 tools, Logstash, ElasticSearch and Kibana. But after all, do we really need such a structure to process log files?
Stacks of log
On a company ecosystem, there is lots of systems, like the CRM, ERP, etc. On such environments, it is common for the systems to produce tons of logs, which provide not only a real-time analysis of the technical status of the software, but could also provide some business information too, like a log of a customer’s behavior on a shopping cart, for example. To dive into this useful source of information, enters the ELK architecture, which name came from the initials of the software involved: ElasticSearch, LogStash and Kibana. The picture below shows in a macro vision the flow between the tools:
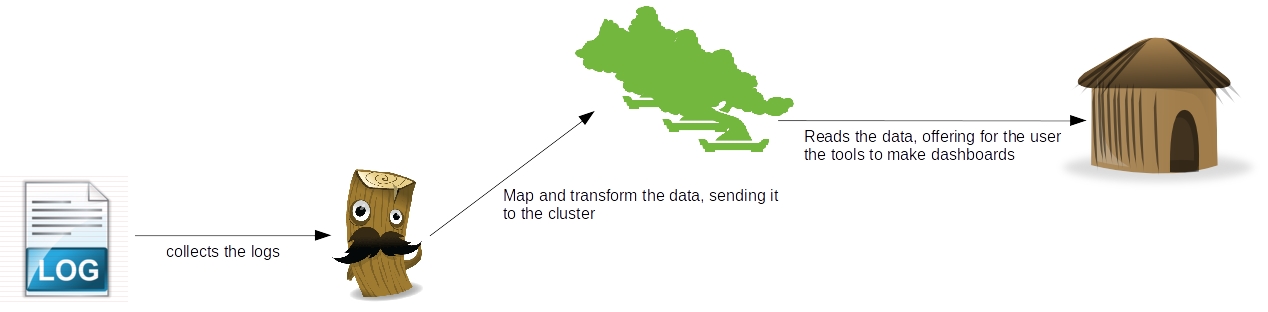 As we can see, there’s a clear separation of concerns between the tools, where which one has his own individual part on the processing of the log data:
- Logstash: Responsible for collect the data, make transformations like parsing – using regular expressions – adding fields, formatting as structures like JSON, etc and finally sending the data to various destinations, like a ElasticSearch cluster. Later on this post we will see more detail about this useful tool;
- ElasticSearch: RESTful data indexer, ElasticSearch provides a clustered solution to make searches and analysis on a set of data. On the second part of our series, we will see more about this tool;
- Kibana: Web-based application, responsible for providing a light and easy-to-use dashboard tool. On the third and last part of our series, we will see more of this tool;
So, to begin our road in the ELK stack, let’s begin by talking about the tool responsible for integrating our data: LogStash.
LogStash installation
To install, all we need to do is unzip the file we get from LogStash’s site and run the binaries on the bin folder. The only pre-requisite for the tool is to have Java installed and configured in the environment. If the reader wants to follow my instructions with the same system then me, I am using Ubuntu 14.10 with Java 8, which can be downloaded from Oracle’s site here.
With Java installed and configured, we begin by downloading and unziping the file. To do this, we open a terminal and input:
curl https://download.elasticsearch.org/logstash/logstash/logstash-1.4.2.tar.gz | tar xz
After the download, we will have LogStash on a folder on the same place we run our ‘curl’ command. On the LogStash terminology, we have 4 types of configurations we can make for a stream, named:
- input: On this configuration, we put the sources of our streams, that can range from polling files of a file system to more complex inputs such as a Amazon SQS queue and even Twitter;
- codec: On this configuration we make transformations on the data, like turning into a JSON structure, or grouping together lines that are semantically related, like for example, a Java’s stack trace;
- filter: On this configuration we make operations such as parsing data from/to different formats, removal of special characters and checksums for deduplication;
- output: On this configuration we define the destinations for the processed data, such as a ElasticSearch cluster, AWS SQS, Nagios etc;
Now that we have established LogStash’s configuration structure, let’s begin with our first execution. In LogStash we have two ways to configure our execution, one way by providing the settings on the start command itself and the other one is by providing a configuration file for the command. The simplest way to boot a LogStash’s stream is by setting the input and output as the console itself, to make this execution, we open a terminal, navigate to the bin folder of our LogStash’s installation and execute the following command:
./logstash -e ‘input { stdin { } } output { stdout {} }’
As we can see after we run the command, we booted LogStash, setting the console as the input and the output, without any transformation or filtering. To test, we simply input anything on the console, seeing that our message is displayed back by the tool:

Now that we get the installation out of the way, let’s begin with the actual lab. Unfortunately -or not, depending on the point of view -, it would take us a lot of time to show all the features of what we can do with the tool, so to make a short but illustrative example, we will start 2 logstash streams, to do the following:
1st stream:
- The input will be made by a java program, which will produce a log file with log4j, representing technical information;
- For now, we will just print logstash’s events on the console, using the rubydebug codec. On our next part on the series, we will return to this configuration and change the output to send the events to elasticsearch;
2nd stream:
- The input will be made by the same java program, which will produce a positional file, representing business information of costumers and orders;
- We will then use the grok filter to parse the data of the positional file into separated fields, producing the data for the output step;
- Finally, we use the mongodb output, to save our data – filtering to only persist the orders – on a Mongodb collection;
With the streams defined, we can begin our coding. First, let’s create the java program which will generate the inputs for the streams. The code for the program can be seen bellow:
package com.technology.alexandreesl;
import java.io.FileWriter;
import java.io.IOException;
import java.io.PrintWriter;
import java.util.ArrayList;
import java.util.Date;
import java.util.List;import org.apache.log4j.Logger;
public class LogStashProvider {
private static Logger logger = Logger.getLogger(LogStashProvider.class);
public static void main(String[] args) throws IOException {
try {
logger.info(“STARTING DATA COLLECTION”);
List<String> data = new ArrayList<String>();
Customer customer = new Customer();
customer.setName(“Alexandre”);
customer.setAge(32);
customer.setSex(‘M’);
customer.setIdentification(“4434554567”);List<Order> orders = new ArrayList<Order>();
for (int counter = 1; counter < 10; counter++) {
Order order = new Order();
order.setOrderId(counter);
order.setProductId(counter);
order.setCustomerId(customer.getIdentification());
order.setQuantity(counter);orders.add(order);
}
logger.info(“FETCHING RESULTS INTO DESTINATION”);
PrintWriter file = new PrintWriter(new FileWriter(
“/home/alexandreesl/logstashdataexample/data”
+ new Date().getTime() + “.txt”));file.println(“1” + customer.getName() + customer.getSex()
+ customer.getAge() + customer.getIdentification());for (Order order : orders) {
file.println(“2” + order.getOrderId() + order.getCustomerId()
+ order.getProductId() + order.getQuantity());
}logger.info(“CLEANING UP!”);
file.flush();
file.close();// forcing a error to simulate stack traces
PrintWriter fileError = new PrintWriter(new FileWriter(
“/etc/nopermission.txt”));} catch (Exception e) {
logger.error(“ERROR!”, e);
}}
}
As we can see, it is a very simple class, that uses log4j to generate some log and output a positional file representing data from customers and orders and at the end, try to create a file on a folder we don’t have permission to write by default, “forcing” a error to produce a stack trace. The complete code for the program can be found here. Now that we have made our data generator, let’s begin the configuration for logstash. The configuration for our first example is the following:
input {
log4j {
port => 1500
type => “log4j”
tags => [ “technical”, “log”]
}
}output {
stdout { codec => rubydebug }
}
To run the script, let’s create a file called “config1.conf” and save the file with the script on the “bin” folder of logstash’s installation folder. Finally, we run the script with the following command:
./logstash -f config1.conf
This will start logstash process with the configurations we provided. To test, simply run the java program we coded earlier and we will see a sequence of message events in logstash’s console window, generated by the rubydebug codec, like the one bellow, for example:
{
“message” => “ERROR!”,
“@version” => “1”,
“@timestamp” => “2015-01-24T19:08:10.872Z”,
“type” => “log4j”,
“tags” => [
[0] “technical”,
[1] “log”
],
“host” => “127.0.0.1:34412”,
“path” => “com.technology.alexandreesl.LogStashProvider”,
“priority” => “ERROR”,
“logger_name” => “com.technology.alexandreesl.LogStashProvider”,
“thread” => “main”,
“class” => “com.technology.alexandreesl.LogStashProvider”,
“file” => “LogStashProvider.java:70”,
“method” => “main”,
“stack_trace” => “java.io.FileNotFoundException: /etc/nopermission.txt (Permission denied)\n\tat java.io.FileOutputStream.open(Native Method)\n\tat java.io.FileOutputStream.<init>(FileOutputStream.java:213)\n\tat java.io.FileOutputStream.<init>(FileOutputStream.java:101)\n\tat java.io.FileWriter.<init>(FileWriter.java:63)\n\tat com.technology.alexandreesl.LogStashProvider.main(LogStashProvider.java:66)”
}
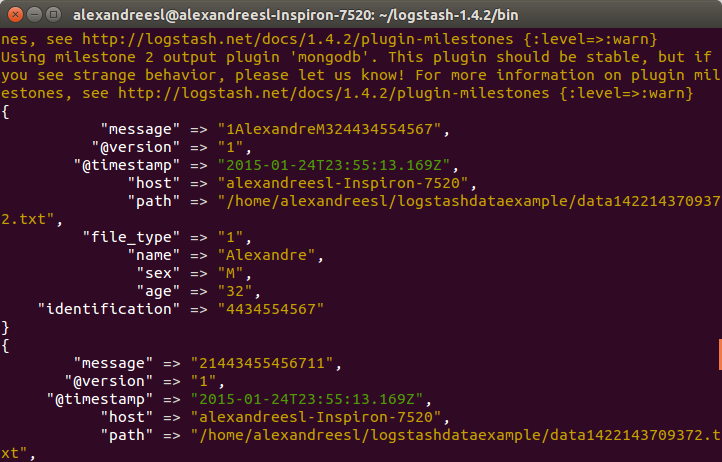
Now, let’s move on to the next stream. First, we create another file, called “config2.conf”, on the same folder we created the first one. On this new file, we create the following configuration:
input {
file {
path => “/home/alexandreesl/logstashdataexample/data*.txt”
start_position => “beginning”
}
}filter {
grok {
match => [ “message” , “(?<file_type>.{1})(?<name>.{9})(?<sex>.{1})(?<age>.{2})(?<identification>.{10})” , “message” , “(?<file_type>.{1})(?<order_id>.{1})(?<costumer_id>.{10})(?<product_id>.{1})(?<quantity>.{1})” ]
}
}output {
stdout { codec => rubydebug }
if [file_type] == “2” {
mongodb {
collection => “testData”
database => “mydb”
uri => “mongodb://localhost”
}
}
}
With the configuration created, we can run our second example. Before we do that, however, let’s dive a little on the configuration we just made. First, we used the file input, which will make logstash keep monitoring the files on the folder and processing them as they appear on the input folder.
Next, we create a filter with the grok plugin. This filter uses combinations of regular expressions, that parses the data from the input. The plugin comes with more then 100 patterns pre-made that helps the development. Another useful tool in the use of grok is a site where we could test our expressions before use. Both links are available on the links section at the end of this post.
Finally, we use the mongodb plugin, where we reference our logstash for a database and collection of a mongodb instance, where we will insert the data from the file into mongodb’s documents. We also used again the rubydebug codec, so we can also see the processing of the files on the console. The reader will note that we used a “if” statement before the configuration of the mongodb output. After we parse the data with grok, we can use the newly created fields to do some logic on our stream. In this case, we filter to only process data with the type “2”, so only the order’s data goes to the collection on mongodb, instead of all the data. We could have expanded more on this example, like saving the data into two different collections, but for the idea of passing a general view of the structure of logstash for the reader, the present logic will suffice.
PS: This example assumes the reader has mongodb installed and running on the default port of his environment, with a db “mydb” and a collection “testData” created. If the reader doesn’t have mongodb, the instructions can be found on the official documentation.
Finally, with everything installed and configured, we run the script, with the following command:
./logstash -f config2.conf
After logstash’s start, if we run our program to generate a file, we will see logstash working the data, like the screen bellow:
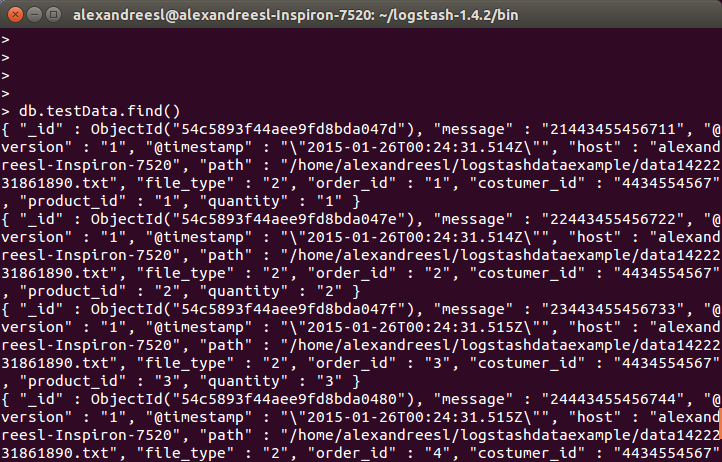
And finally, if we query the collection on mongodb, we see the data is persisted:
Conclusion
And so we conclude the first part of our series. With a simple usage, logstash prove to be a useful tool in the integration of information from different formats and sources, specially log-related. In the next part of our series, we will dive in the next tool of our stack: ElasticSearch. Until next time

5 thoughts on “ELK: using a centralized logging architecture – part 1”